Francisco Saavedra
Welcome to my portfolio webpage. Here I will upload projects that I have done and collaborated with. This webpage will be updated continuously. Feel free to check my GitHub profile for all my repositories.
Experience
Software Engineer II
Software Engineer
Associate Manufacturing Engineer - Automation
Manufacturing Engineering - Technician
Electrical Engineer - Internship
Distribution Operating Engineer - Internship
Education
Capella University
Relevant Coursework:
University of Minnesota
Relevant Coursework:
Online Courses
University of Minnesota: Data Visualization and Analytics Boot Camp
- July 2023 - December 2023
Rockwell Automation E-learning
|
|
|
University of Minnesota: Coding Boot Camp
- July 2020 - December 2020
Projects
Random Password Generator
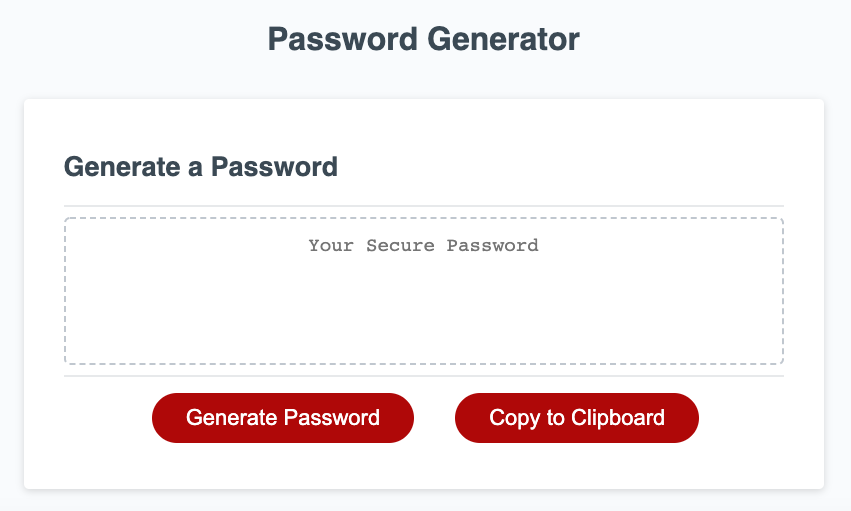
Passwords are a real security threat. Over 80% of hacking-related breaches are due to weak or stolen passwords. If you want to safeguard your personal info and assets, creating secure passwords is a big first step. That’s where this Random Password Generator comes in. Impossible to crack passwords are complex with multiple types of characters (letters, numbers, and symbols). And the best part, it’s FREE. Give it a try!
JavaScript Quiz
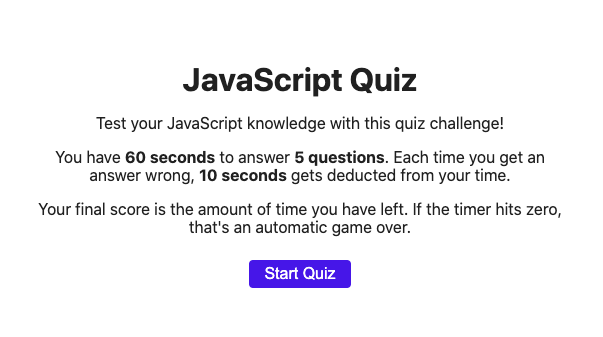
Ever wondered if you truly are a JavaScript Master? Well, now's your chance to test your knowledge with this JavaScript Quiz. Give it a go and see if you can be in the top highscore spot.
Weather Dashboard
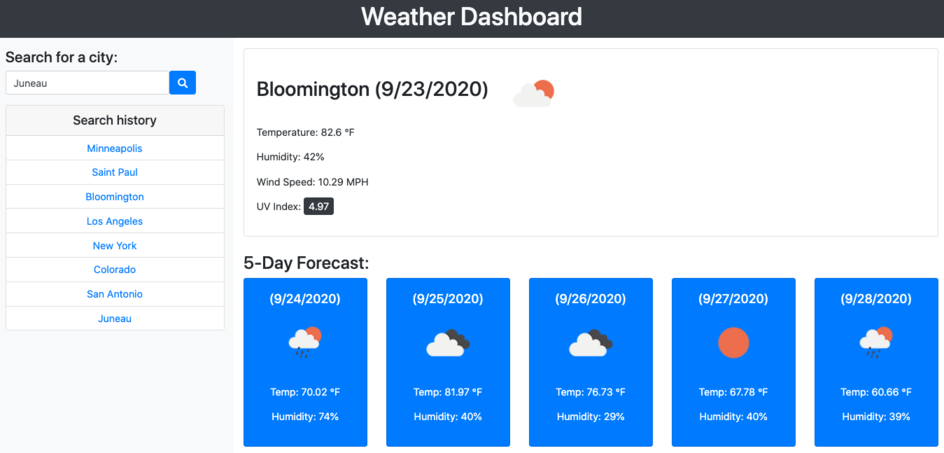
Knowing the weather is something that we all pretty much need to know. Especially, for an upcoming trip. Well you're in luck! With this Weather Dashboard, you can seach for the city that you are planning to visit and pick your clothes accordingly for up to 5 days in advance.
Eat Local
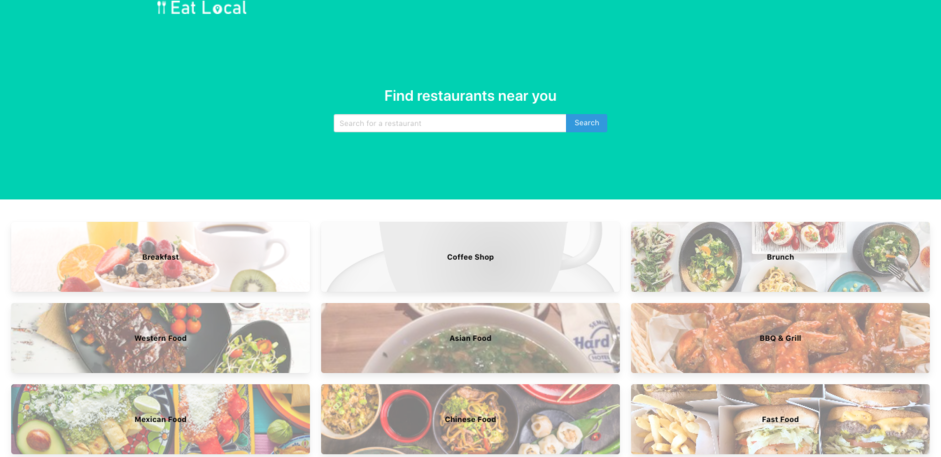
Are you hungry, but don't know what to eat? Well, now you can find great places to eat within a 10km radius of your spot. Search for food that you want to eat or simply choose from one of the many catagories. With this app, you will find the place you want to eat!
Connect 4
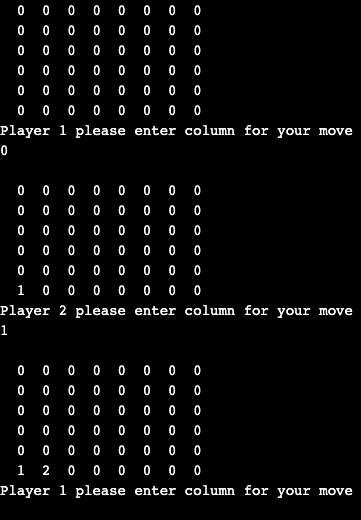
Connect 4 is a two player connection computer game, in which the players take turns to see who can connect 4 first. The numbers (1 or 2) fall straight down, occupying the lowest available space within the columns. The player can win by connecting 4 of their numbers in a horizontal, vertical, or diagonal line.
Weather Data Visualization
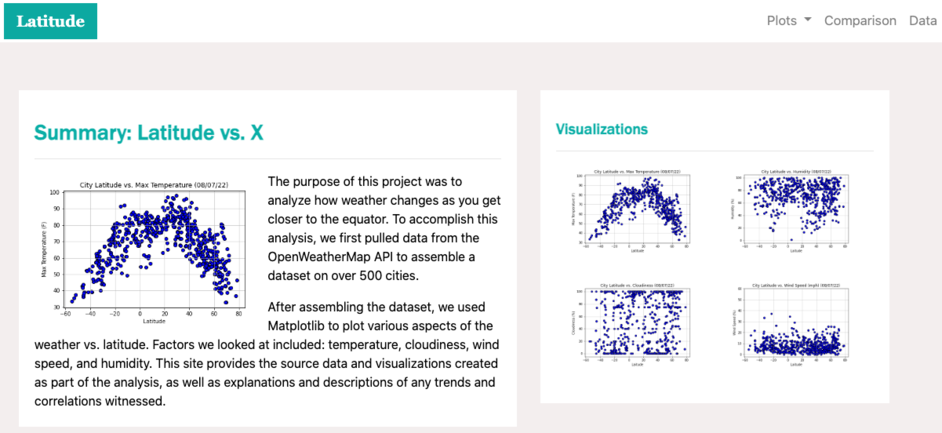
This is a Weather Data Visualization dashboard that will let the viewer see the data that was used to create the graphs. When the graphs are clicked in the Visualizations sections, it will take the viewer to that specific graph an give a summary. Similar to the scroll bar, due take a look at the comparison and data pages to see more!
Interactive Dashboard
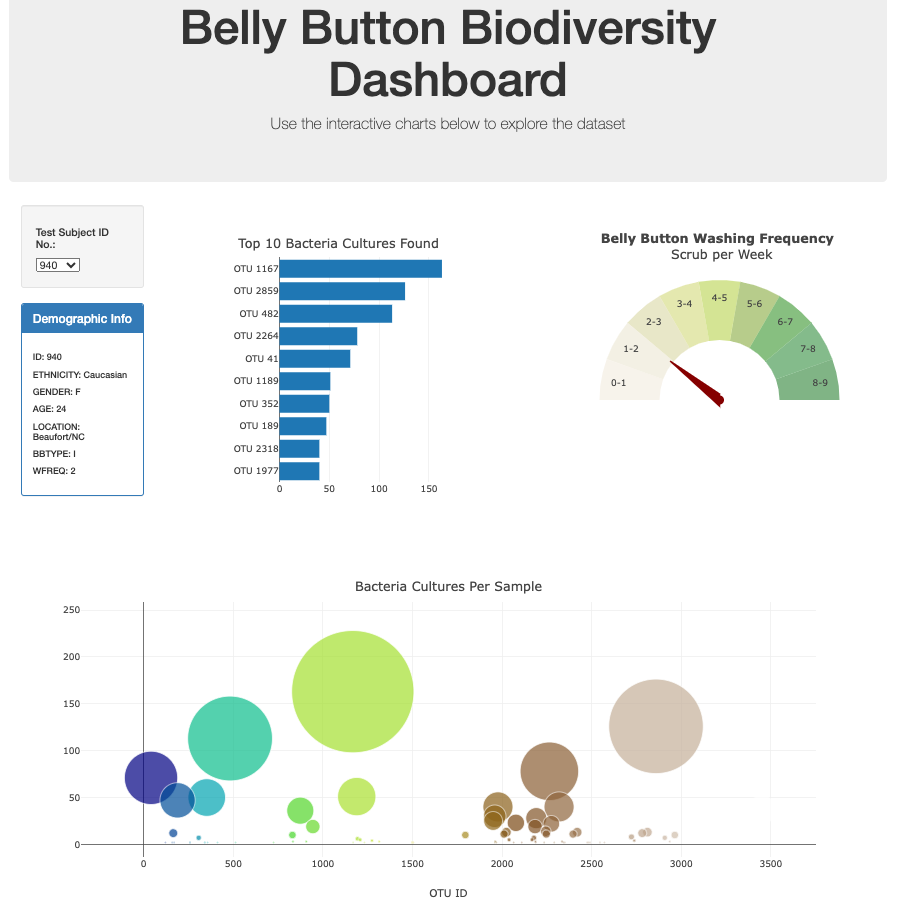
This is an Interactive Dashboard that lets the viewer explore the data that was obtained from the Belly Button Biodiversity dataset. The dataset reveals that a small handful of microbial species (also called operational taxonomic units, or OTUs, in the study) were present in more than 70% of people, while the rest were relatively rare. Explore few or all of the Test ID's to view the unique data!
Earthquake and Tectonic Plates Visualization
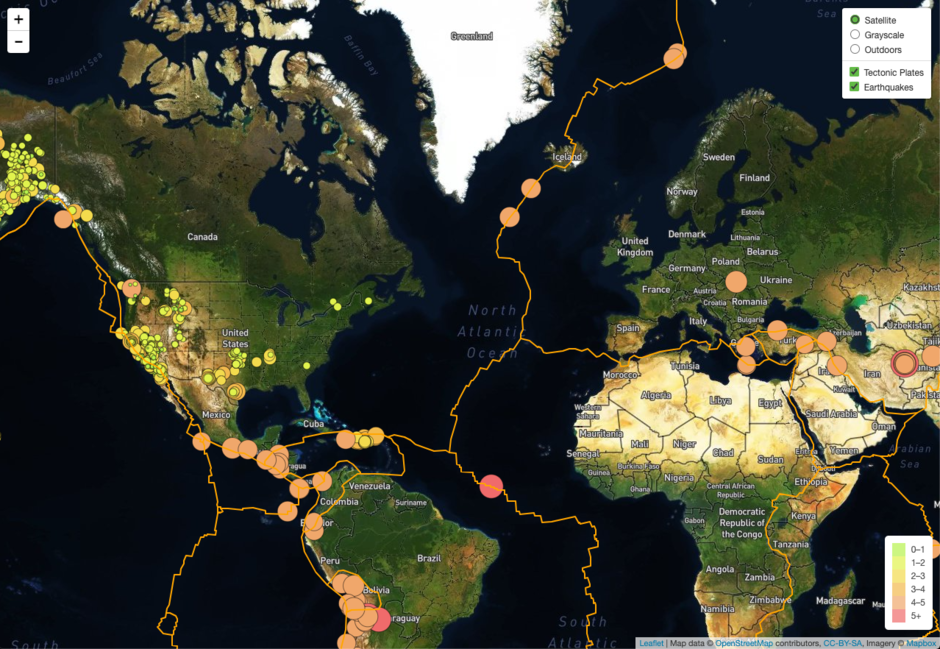
This is an interactive Earthquake and Tectonic Plates Visualization map the lets the user view where earthquakes have occured around the world. The data that was used to create this visual is from the USGS GeoJSON Feed and Github: tectonicplates.
Tableau Analysis Dashboard
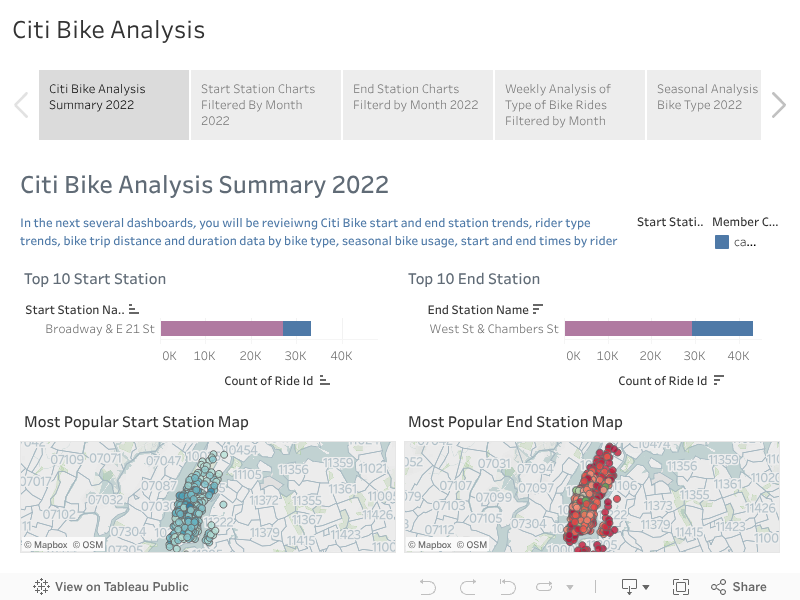
Since 2013, the Citi Bike Program has implemented a robust infrastructure for collecting data on the program's utilization. Through the team's efforts, each month bike data is collected, organized, and made public on the Citi Bike Data webpage. However, while the data has been regularly updated, the team has yet to implement a dashboard or sophisticated reporting process. That's where this dashboards comes in. This story provides information regarding the 2022 year to get a better accurate measure of data. Check the dashboard out to see what story it tells!
World Energy Consumption and Generation
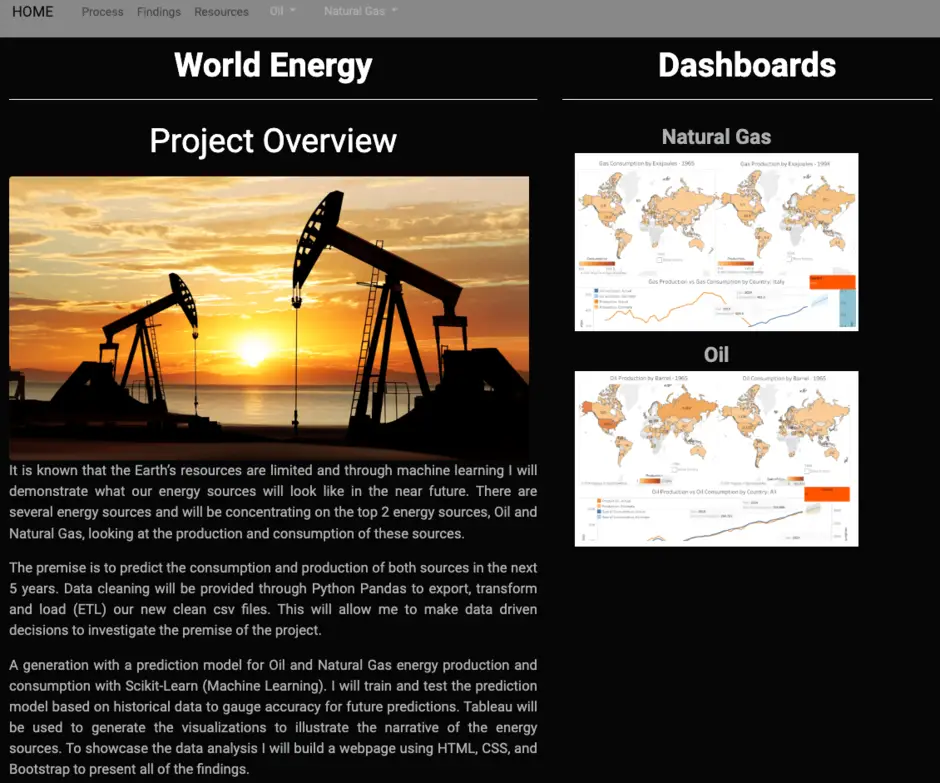
It is know that the Earth’s resources are limited. I will discover what energy sources would look like in the near future. Out of the different energy sources the focus will be the top 2 energy production and consumption sources: Oil and Gas. The premise is to predict the consumption and production of both sources in the next 5 years. Data cleaning will be done using Python Pandas to perform the ETL (Extract, Transform, and Load) process for the new cleaned csv files. This will allow me to make data driven decisions to investigate the premise of the project. Prediction models for oil and gas energy production and consumption with Scikit-Learn (Machine Learning). I will train and test the prediction model based on historical data to gauge accuracy for future predictions based on trends. Tableau will be used to generate the visualizations to illustrate the narrative of the energy sources (oil and gas). To showcase the data analysis I will build a webpage using HTML, CSS, and Bootstrap to present all of the findings.
Skills
- Microsoft Office
- AutoCAD
- Solidworks
- RockwellStudio 5000
- FactoryTalk ME/SE
- Visual Sudio
- PyCharm
- Jupyter Notebook
- Microsoft SQL Server
- PostgreSQL
- Function Generator
- Oscilloscope
- Mac/Windows/Linux OS

- Git
- Agile Development
- Cross Functional Teamwork
- Project Management
Interests
On the engineering side, I love to fix things, solve problems and find out why things work. Every day when I walk into work I know there will be a new problem to solve or a different device to fix. The satisfaction I get by using my engineering skills to solve problems is why I get out of bed in the morning. Knowing that what I do makes a difference within the company and to the end-user is so fulfilling. My ambition is to continue to gain knowledge so I can take on bigger and more challenging problems. I want to continue to use my skills to make a difference by continuously improving the way we engineer things.
On the software side, I really enjoy building web applications, I do fullstack work on side projects. I enjoy building tools that automate a tedious task, that and/or help users improve their life and be more productive.
Outside of engineering & software, you might find me reading a book, playing some tennis, or deeply invested in a videogame.
If you are looking for an energetic person to take on challenges, I am always looking for new enriching experiences.